

New Relic is mostly known for application monitoring, but its infrastructure agent is a solid way to watch plain Linux servers too. One small package, one config line with your license key, and a couple of minutes later you’re looking at CPU, memory, disk, network and every running process in a web dashboard. No exporters to wire up, no time-series database to babysit.
This guide installs the agent on RHEL 9 and Ubuntu, shows what it actually collects, how to tune it, how to query the data and alert on it, and what the failures look like when something’s off. Everything below was run on real servers: RHEL 9.6 and Ubuntu 26.04.
What New Relic Infrastructure Monitoring Collects
The infrastructure agent (newrelic-infra) is a small Go binary that runs as a systemd service. Out of the box it reports four kinds of data, each stored as its own event type you can query later:
- SystemSample. CPU, load average, memory and swap. The numbers you check first.
- StorageSample. Disk usage and I/O per mounted filesystem.
- NetworkSample. Traffic, packets and errors per interface.
- ProcessSample. Per-process CPU and memory. Off by default on newer accounts, more on that below.
It also records inventory: installed packages, kernel parameters, systemd services and config. That part’s underrated. When a server suddenly misbehaves, “what changed?” is often answered by an inventory diff showing a package that got upgraded overnight.
The agent also bundles Fluent Bit, so it can forward log files to New Relic as well. That’s handy, but it’s optional, and we stick to metrics here.
Before You Start
- A New Relic account. The free tier is enough for a few servers. At the time of writing it includes 100 GB of data ingest per month.
- Your license key. In New Relic, open your user menu, then API keys, and copy the key of type INGEST – LICENSE. Use Copy key from the row’s … menu, not Copy key ID right next to it, which gives a 64-character ID the agent rejects. A real license key is 40 characters and ends in
NRAL. And not a User key (NRAK-...) either. - Root or sudo access on the server.
- Outbound HTTPS (port 443) to New Relic. The agent only ever connects out, so there’s no inbound port to open.
New Relic does have a guided install that you paste from the web UI as one command. It’s fine for a single box. The package manager method below is better for anything you’ll automate later with Ansible or a cloud-init script, and it shows you exactly what’s being installed.
Install the New Relic Agent on RHEL 9
This works the same on Rocky Linux, AlmaLinux and Oracle Linux 9. Add the repository:
sudo curl -so /etc/yum.repos.d/newrelic-infra.repo https://download.newrelic.com/infrastructure_agent/linux/yum/el/9/x86_64/newrelic-infra.repo

cat /etc/yum.repos.d/newrelic-infra.repo
[newrelic-infra]
name=New Relic Infrastructure
baseurl=https://download.newrelic.com/infrastructure_agent/linux/yum/el/9/x86_64/
gpgkey=https://download.newrelic.com/infrastructure_agent/keys/newrelic_rpm_key_current.gpg
gpgcheck=1
repo_gpgcheck=1
On an ARM server, swap x86_64 for aarch64 in the URL. Next, refresh just that repo. This is where the GPG key gets imported:
sudo yum -q makecache -y --disablerepo='*' --enablerepo='newrelic-infra'
Importing GPG key 0x8ECCE87C:
 Userid     : "infrastructure-eng <infrastructure-eng@newrelic.com>"
 Fingerprint: A758 B3FB CD43 BE8D 123A 3476 BB29 EE03 8ECC E87C
 From       : https://download.newrelic.com/infrastructure_agent/keys/newrelic_rpm_key_current.gpg
Then install the package:
sudo yum install newrelic-infra -y
...
Installed:
  fluent-bit-5.0.8-1.x86_64                  libpq-13.23-3.el9_8.x86_64
  newrelic-infra-1.80.5-1.el9.x86_64

Complete!

newrelic-infra --version
New Relic Infrastructure Agent version: 1.80.5, GoVersion: go1.26.8, GitCommit: 2022083bacc239b5748feee44265b0e341a9de91, BuildDate: 2026-09-24T09:42:35Z
Fluent Bit comes along for log forwarding, and libpq is there for the bundled PostgreSQL integration. The service is enabled automatically, but it won’t run yet. We’ll get to that.
Install the New Relic Agent on Ubuntu
Import the signing key and add the repository. New Relic’s docs list Ubuntu releases up to 24.04 (noble). Use your release’s codename if it’s listed:
curl -fsSL https://download.newrelic.com/infrastructure_agent/gpg/newrelic-infra.gpg | sudo gpg --dearmor -o /etc/apt/trusted.gpg.d/newrelic-infra.gpg

echo 'deb https://download.newrelic.com/infrastructure_agent/linux/apt/ noble main' | sudo tee /etc/apt/sources.list.d/newrelic-infra.list
deb https://download.newrelic.com/infrastructure_agent/linux/apt/ noble main

sudo apt-get update
...
Get:4 https://download.newrelic.com/infrastructure_agent/linux/apt noble InRelease [10.8 kB]
Get:6 https://download.newrelic.com/infrastructure_agent/linux/apt noble/main amd64 Packages [155 kB]

sudo apt-get install -y newrelic-infra
...
Setting up newrelic-infra (1.80.5)…
Created symlink '/etc/systemd/system/multi-user.target.wants/newrelic-infra.service' → '/etc/systemd/system/newrelic-infra.service'.
Setting up fluent-bit (5.0.8)…
What about Ubuntu 26.04? It isn’t on New Relic’s supported list yet, and there’s no resolute repo. I ran the exact commands above on a fresh 26.04 server, pointing at the noble repo, and the agent installed cleanly: same version 1.80.5, same dependencies. That’s a workaround, though, not a supported setup. Fine for a lab, but check the official list before you rely on it in production.
Add Your License Key and Start the Agent
All configuration lives in /etc/newrelic-infra.yml, and the package doesn’t create it for you. The only required line is the license key:
echo "license_key: YOUR_LICENSE_KEY" | sudo tee -a /etc/newrelic-infra.yml
sudo systemctl restart newrelic-infra
systemctl status newrelic-infra --no-pager
● newrelic-infra.service - New Relic Infrastructure Agent
Loaded: loaded (/etc/systemd/system/newrelic-infra.service; enabled; preset: enabled)
Active: active (running) since Wed 2026-10-07 21:44:43 PKT; 30s ago
Main PID: 9241 (newrelic-infra-)
Tasks: 18 (limit: 1582)
Memory: 29.3M (max: 1G, available: 994.6M, peak: 32.4M)
CPU: 2.448sThat’s the Ubuntu 26.04 box. Active, not looping. The line that proves New Relic accepted your key is connect got id in the journal:
sudo journalctl -u newrelic-infra --no-pager | grep "connect got id"
level=info msg="connect got id" agent-guid=ODU5NDgyN3xJTkZSQXxOQXw0OTYzMjQ2OTIyNDUzNzQ5MzA4 agent-id=4963246922453749308 component=IdentityConnectService
If you see 401 Unauthorized there instead, the key is wrong. See the troubleshooting section below.
Two other lines show up on a fresh agent and look worse than they are. On a host without Docker, unable to initialize docker client, maybe it is not installed on the host is just the container sampler noting there’s nothing to watch. And cannot build supervisor executor ... failed to load log configs process=log-forwarder means log forwarding has no config yet; /etc/newrelic-infra/logging.d/ only ships .example files. Metrics aren’t affected by either.
Data usually shows up in New Relic under Infrastructure, then Hosts, within a couple of minutes.
Useful Configuration Options
The license key is enough to get started, but a few more lines make the data much easier to work with once you’ve got more than a handful of servers:
license_key: YOUR_LICENSE_KEY
display_name: app1-prod
enable_process_metrics: true
custom_attributes:
  environment: production
  team: platform
  role: web
log:
level: infodisplay_namesets how the host appears in the UI. Hostnames likeip-10-0-3-17mean nothing at 3am.enable_process_metricsturns on per-process data. It’s off by default on newer accounts because it can add a lot of data. Turn it on where you need it, since “which process is eating the CPU?” is half of troubleshooting.custom_attributesare tags attached to every event the host sends. You’ll use them to filter dashboards and scope alerts, for example “production web servers only”.log.levelcan go todebugtemporarily when the agent misbehaves. Set it back afterwards, because debug logs are noisy.
Restart the agent after any change with sudo systemctl restart newrelic-infra.
Query Your Server Data with NRQL
The dashboards are fine, but the real power is NRQL, New Relic’s SQL-like query language. Open Query your data in the UI and try these:
SELECT average(cpuPercent), average(memoryUsedPercent) FROM SystemSample FACET hostname SINCE 1 hour ago

SELECT max(diskUsedPercent) FROM StorageSample FACET hostname, mountPoint SINCE 30 minutes ago

SELECT average(cpuPercent) FROM ProcessSample FACET processDisplayName WHERE hostname = 'app1' LIMIT 10

SELECT average(receiveBytesPerSecond), average(transmitBytesPerSecond) FROM NetworkSample FACET interfaceName TIMESERIES
Here’s what they returned on our two test servers, a few minutes after the agents connected:
-- CPU and memory per host
hostname   average.cpuPercent   average.memoryUsedPercent
app1       53.63                27.48
mylinux    4.32                 48.72

-- Disk per mount point
hostname   mountPoint   max.diskUsedPercent
app1       /boot        78.49
app1       /            17.09
mylinux    /            11.45
app1       /home        0.88

-- Top processes on app1
processDisplayName   average.cpuPercent
sha256sum            97.95
docker               0.63
containerd           0.61
systemd              0.58
newrelic-infra       0.41
redis-server         0.29

-- Network per interface
hostname   interfaceName   receiveBytesPerSecond   transmitBytesPerSecond
mylinux    ens33           1024.76                 1317.12
app1       ens160          970.93                  1461.53
app1       docker0         0.00                    0.00
Notice how the queries answer each other. app1 sits at 54% CPU, and the process query immediately says why: a single sha256sum process using a full core (it’s a deliberately busy test container). /boot at 78% is the other thing worth a look, since small boot partitions fill up with old kernels. And newrelic-infra itself costs 0.4% CPU, so the agent isn’t the problem. Here’s that process query as a chart:

The FACET clause is the one to remember. It splits results by host, mount point or process, so you can spot the one server that’s different from the rest. That’s usually where the problem is.
Set Up an Alert
Monitoring nobody looks at is just storage. At minimum, set up these two alerts:
- Host not reporting. In Alerts, create a condition of type Host not reporting and scope it to your servers. If the agent or the whole machine goes quiet for a few minutes, you hear about it.
- Sustained high CPU or disk. Create an NRQL alert condition like the one below, with a critical threshold above 90 for at least 5 minutes:
SELECT average(cpuPercent) FROM SystemSample FACET hostnameThe “for at least 5 minutes” part matters. CPU spikes to 100% all the time during backups, package updates and cron jobs. Alert on spikes and your team will mute the channel within a week. Alert on sustained load and every notification means something. The same goes for disk: alerting at 90% full gives you time to act. Alerting at 99% gives you an outage.
Route notifications to email, Slack or PagerDuty through a workflow, so the right person actually sees the alert.
Troubleshooting the New Relic Agent
Agent Keeps Restarting: “no license key”
This is what you get if you start the agent before creating the config file. I hit it on purpose on the RHEL box, right after the install:
systemctl status newrelic-infra --no-pager
● newrelic-infra.service - New Relic Infrastructure Agent
     Loaded: loaded (/etc/systemd/system/newrelic-infra.service; enabled; preset: disabled)
     Active: activating (auto-restart) (Result: exit-code) since Wed 2026-10-07 09:57:36 PKT; 3s ago
   Main PID: 75945 (code=exited, status=1/FAILURE)

journalctl -u newrelic-infra --no-pager -n 15
...
newrelic-infra-service[75952]: time="2026-10-07T09:57:36+05:00" level=error msg="can't load configuration file" component="New Relic Infrastructure Agent" error="no license key, please add it to agent's config file or NRIA_LICENSE_KEY environment variable"
newrelic-infra-service[75945]: time="2026-10-07T09:57:36+05:00" level=info msg="child process exited" exit_code=1
systemd[1]: newrelic-infra.service: Main process exited, code=exited, status=1/FAILURE
Status activating (auto-restart) means systemd keeps retrying and the agent keeps dying. The log says exactly why. Add the key to /etc/newrelic-infra.yml and restart. The error also mentions NRIA_LICENSE_KEY: every config option can be set as an environment variable with the NRIA_ prefix, which is handy in containers. For more on reading service logs, see our journalctl guide.
The PIDFile Warning
On RHEL 9 you’ll also see this in the journal:
systemd[1]: /etc/systemd/system/newrelic-infra.service:16: PIDFile= references a path below legacy directory /var/run/, updating /var/run/newrelic-infra/newrelic-infra.pid → /run/newrelic-infra/newrelic-infra.pid; please update the unit file accordingly.Harmless. systemd is telling the packager to update a path, and it already fixes it automatically. Don’t edit the unit file yourself, because the next package update will overwrite it.
Agent Runs but No Data Appears
- Wrong key. The agent runs, but the journal keeps repeating
agent connect attempt failed ... error="ingest rejected connect: 401 401 Unauthorized ". You pasted something other than the INGEST – LICENSE key: a User key (NRAK-...) or the 64-character key ID. Copy it again with Copy key. - Outbound traffic blocked. The server needs HTTPS out to New Relic. Test it with
curl -sI https://infra-api.newrelic.com. If your network forces a proxy, setproxy:in the config file. - Wrong region. EU accounts use EU endpoints. The agent works this out from an EU license key, but double-check if you copied the key from a different account.
- Clock skew. If the server’s time is badly off, data can land in the wrong time window and look missing. Make sure chrony or systemd-timesyncd is running.
New Relic vs Open-Source Monitoring
Fair question: why pay for this when Prometheus, Grafana and Zabbix are free? Honestly, for a few servers the free tier makes it a non-issue, and you skip running a monitoring stack of your own. At scale, the trade-off is money against time. New Relic costs grow with how much data you send. A self-hosted stack costs servers and engineer hours. Many teams use both: open-source for the core, and New Relic for application performance and correlation across services. If you want to understand what these tools are measuring under the hood, our Linux system monitoring guide covers the same metrics with plain command-line tools.
Setup Confirmation
Both servers, agent running and connected:
# app1 (RHEL 9)
systemctl status newrelic-infra --no-pager
● newrelic-infra.service - New Relic Infrastructure Agent
     Loaded: loaded (/etc/systemd/system/newrelic-infra.service; enabled; preset: disabled)
     Active: active (running) since Wed 2026-10-07 21:44:12 PKT; 30s ago
   Main PID: 15486 (newrelic-infra-)
     Memory: 30.4M (max: 1.0G available: 993.5M)
sudo journalctl -u newrelic-infra --no-pager | grep "connect got id"
level=info msg="connect got id" agent-guid=ODU5NDgyN3xJTkZSQXxOQXw4NTUxMjE4MTAwODg2NDg2NDg5 agent-id=8551218100886486489 component=IdentityConnectService

# mylinux (Ubuntu 26.04)
systemctl status newrelic-infra --no-pager
● newrelic-infra.service - New Relic Infrastructure Agent
     Active: active (running) since Wed 2026-10-07 21:44:43 PKT; 30s ago
     Memory: 29.3M (max: 1G, available: 994.6M, peak: 32.4M)
sudo journalctl -u newrelic-infra --no-pager | grep "connect got id"
level=info msg="connect got id" agent-guid=ODU5NDgyN3xJTkZSQXxOQXw0OTYzMjQ2OTIyNDUzNzQ5MzA4 agent-id=4963246922453749308 component=IdentityConnectService
Both hosts reporting in New Relic, with the display_name and custom_attributes from the config above attached to every event:
SELECT latest(displayName), latest(environment), latest(role), latest(linuxDistribution), latest(kernelVersion), latest(agentVersion) FROM SystemSample FACET hostname SINCE 5 minutes agohostname displayName environment role linuxDistribution kernelVersion agentVersion
mylinux mylinux lab monitoring Ubuntu 26.04 LTS 7.0.0-34-generic 1.80.5
app1 app1 lab docker-host Oracle Linux Server 9.6 5.15.0-314.193.5.4.el9uek.x86_64 1.80.5(Our “RHEL” test box is built from Oracle Linux 9.6 repos, and the agent reports what it actually finds. Same EL9 packages, same steps.) The Ubuntu row also settles the 26.04 question from earlier: installed from the noble repo, the agent connects and reports normally.
In the New Relic UI, the same host under Infrastructure > Hosts > app1. CPU sits around 50%, the disk table matches the NRQL result above (/dev/nvme0n1p1, which is /boot, at 78.49%), and Processes running puts sha256sum at the top, exactly like the process query:

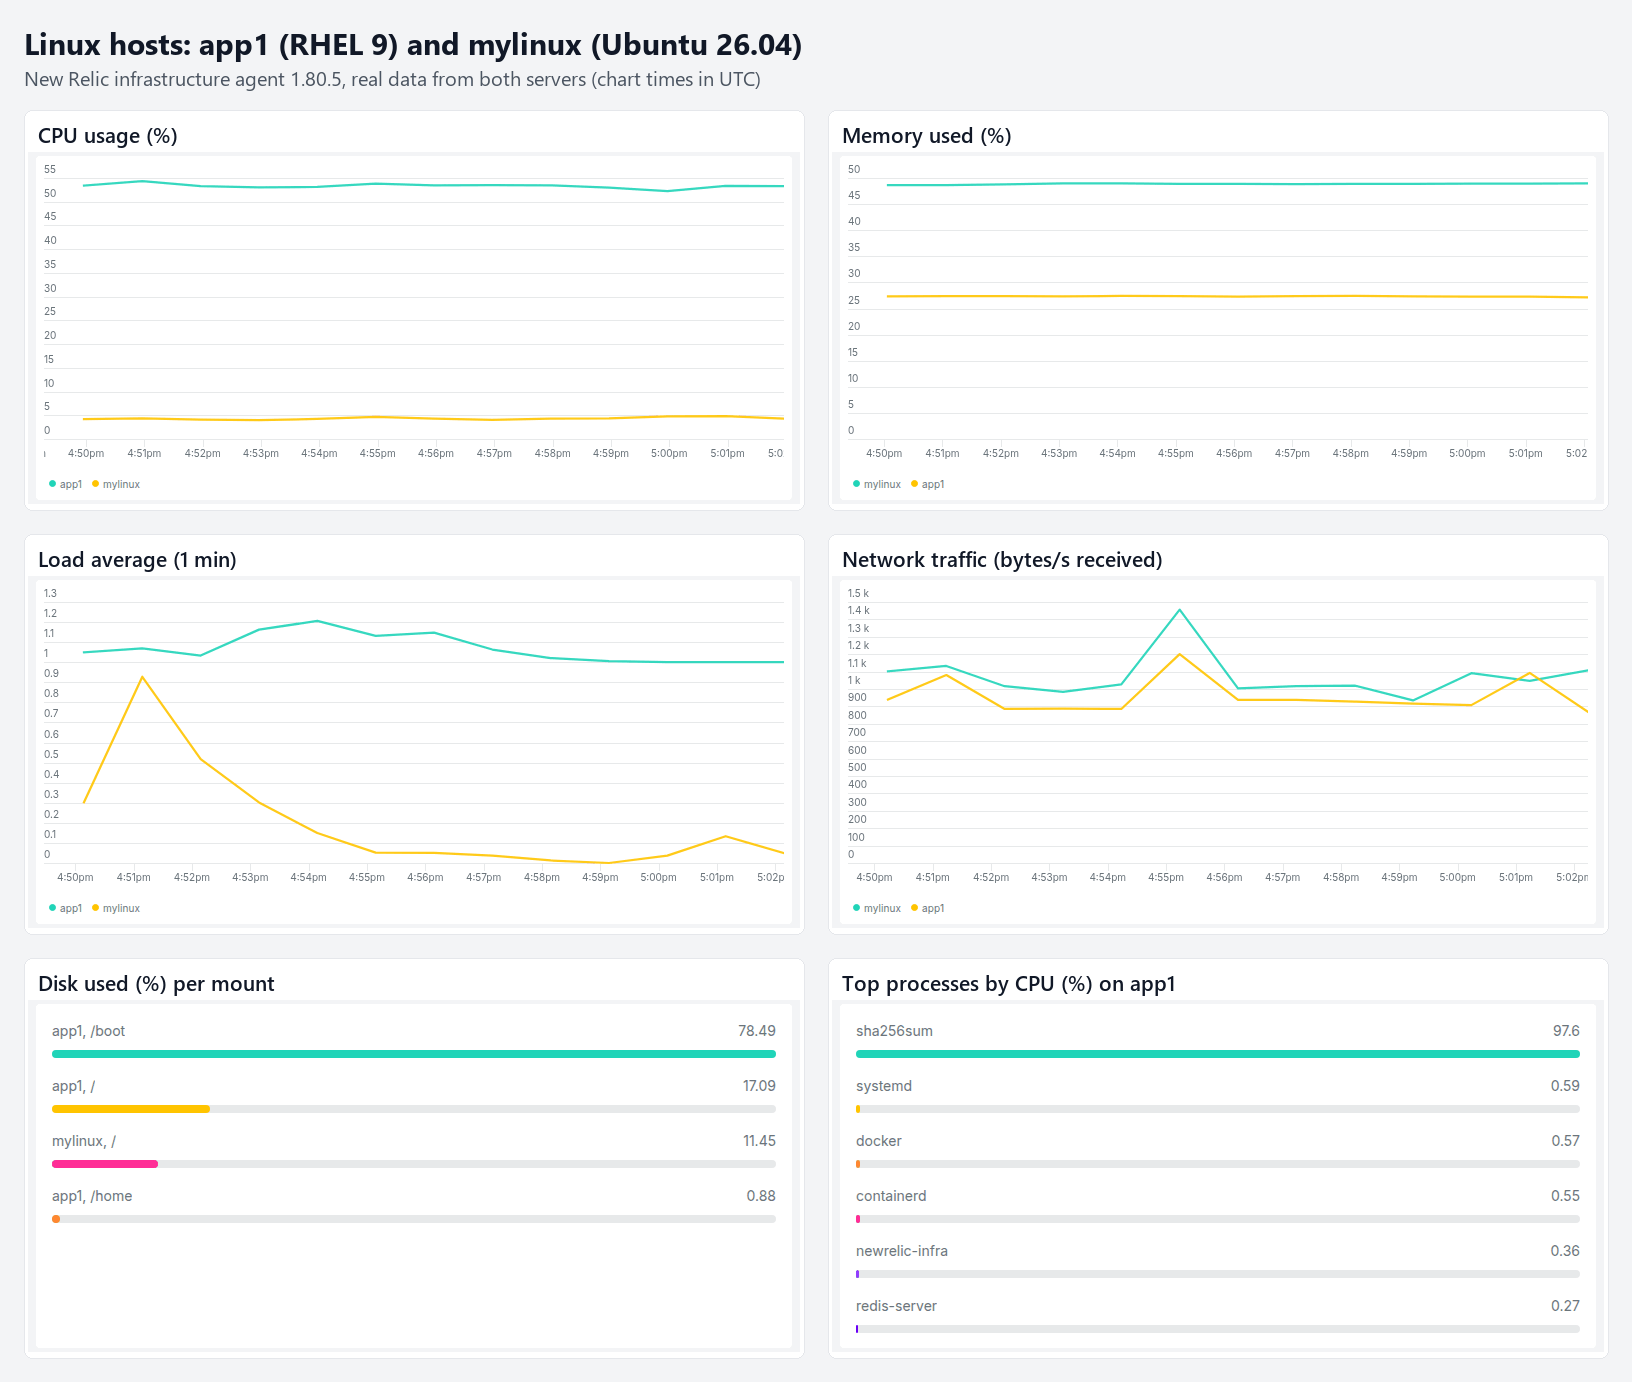
And the metrics that matter most, side by side for both servers: CPU, memory, load, network, disk per mount and the busiest processes. Every panel is a New Relic chart built from the NRQL queries in this post, so you can recreate the same dashboard in your account with Dashboards > Create a dashboard and one query per widget:
Frequently Asked Questions
Is New Relic infrastructure monitoring free?
There’s a free tier that includes a monthly data ingest allowance (100 GB at the time of writing) and one full platform user. That’s plenty for a few servers. Paid plans charge mainly for data ingest and users.
Which Linux distributions does the New Relic agent support?
RHEL, CentOS, Rocky Linux, AlmaLinux, Oracle Linux, Amazon Linux, Debian, Ubuntu LTS releases and SUSE, on x86_64 and ARM64. Check New Relic’s docs for the current list, because newer releases like Ubuntu 26.04 can lag behind.
How much CPU and memory does the agent use?
Very little. On our servers it used about 30 MB of RAM (29.3 MB and 30.4 MB in systemctl status) and 0.4% CPU according to its own process metrics. Enabling process metrics and log forwarding adds some overhead, so turn on only what you’ll use.
Where is the New Relic infrastructure agent config file?
On Linux it’s /etc/newrelic-infra.yml. The only required setting is license_key. Restart the service after editing it.
How do I uninstall the New Relic agent?
Stop the service, then remove the package: sudo yum remove newrelic-infra on RHEL or sudo apt-get remove newrelic-infra on Ubuntu. Delete /etc/newrelic-infra.yml and the repo file if you’re not reinstalling.
Can New Relic monitor Docker containers on the same host?
Yes. The infrastructure agent detects Docker on the host and reports container metrics too. Kubernetes clusters use a separate Helm-based install, which is a topic of its own. If you’re new to containers, start with working with Docker containers, and for the container side in New Relic see how to monitor Docker containers with New Relic.


